Monday, April 06, 2015

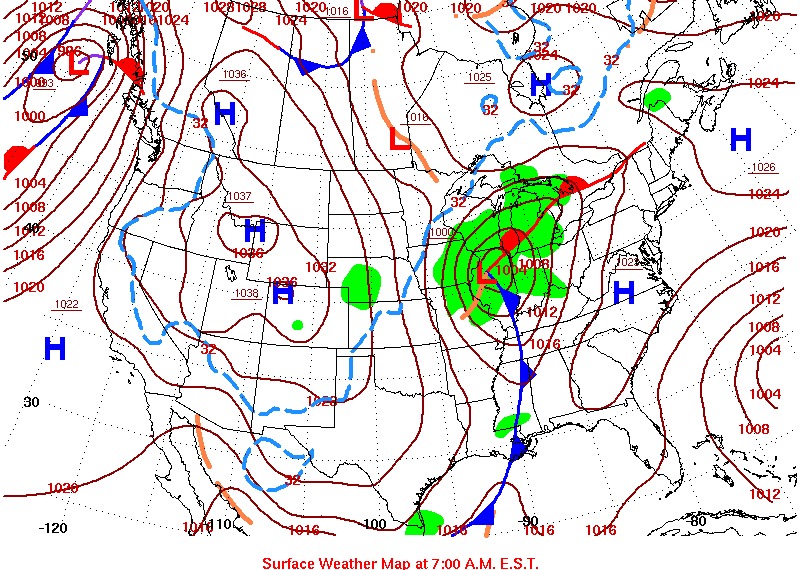
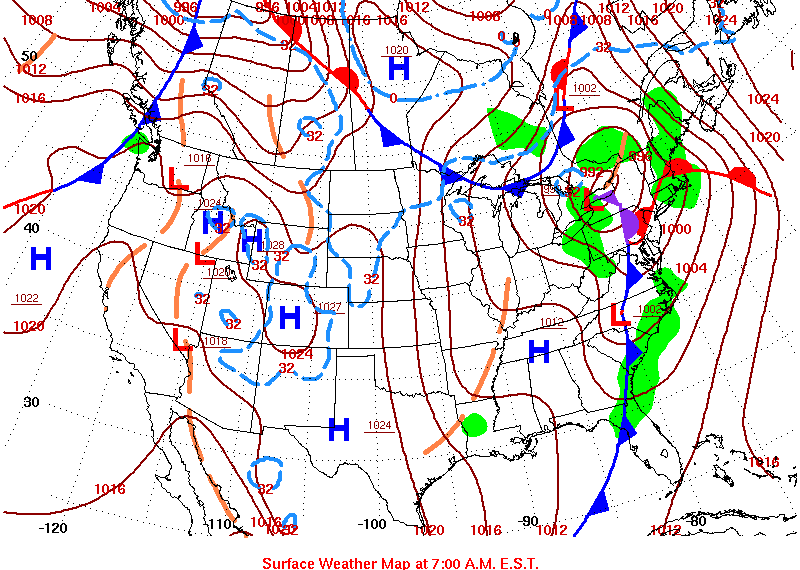
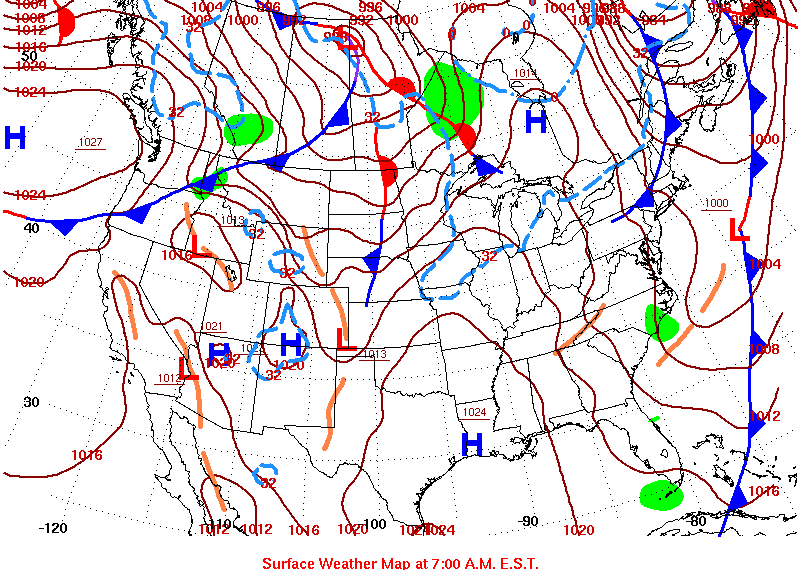
Weathercharts for the dates of OK corralled.

With the charts at the following site:
http://www.hpc.ncep.noaa.gov/dailywxmap/index_20140413.html
it may be possible to compare the events leading up to OK quakes arranged by date. I am presuming the servers involved are showing them in the order I selected them. There is no accounting according to legend. I have no idea why they are not dated:

2010-Feb-27     Marble City     4.3     35.6     -94.9


2010-Oct-13     Langston     4.2     35.89019     -97.26905
Damn!
I just realised the other chart has a date on it and I have to collect them all over again.
2010-Nov-24     Marshall     4.2     36.12546     -97.63979


2011-Nov-05     Wellston     4.2     35.68074     -97.09777
2011-Nov-06      Prague     5.6     35.53162     -96.77137
2011-Nov-06     Coalpont lake     4.2     34.676     -96.499
2011-Nov-08     NE Faxon     4.2     34.5     -98.5


2012-Apr-03     Langston     4.1     35.89254     -97.29209

2013-Apr-16      Guthrie     4.1     35.77453     -97.48264
2013-Apr-16      Marshall     4.1     36.13124     -97.63078
2013-Dec-07     Langston     4.1     35.89136     -97.29668
2013-Dec-29     Prauge     4.1     35.535     -96.757

2014-Feb-09     Marshall     4.0     36.13519     -97.62569

2014-Mar-30     Lindsay     4.0     34.761     -97.55
2014-Mar-30     Ada     4.0     34.8     -96.7
2014-Mar-30     El Reno     4.0     35.5     -98

2014-Apr-05     Antioch     4.1     34.712     -97.542
2014-Apr-06     Wilburton     4.1     34.9     -95.3
2014-Apr-07     Catoosa     4.1     36.2     -95.8
2014-Apr-10     Prauge     4.0     35.519     -96.784


Saturday, April 04, 2015

Gas Fracking. Looking and cooking.

I have never been interested in the petroleum industry. There is no money in it for me. Nobody is going to hire me as an expert or anything. You can find sites for natural gas well by looking at a map and once you know what to look for I am out of the equation. So here is the way you do it. Gas wells are found in the centres of circular depressions that are as regular as cenotes and volcano caldera.

All you need is an aerial or an OS map. Following the contours is easy enough once you "get your eye in". Any beach will show it to you as plain as day. They are called Half Moon Bays. But any regular circular bays will have oil and/or just gas in the centre.

Or not, as the case may be.
I don't have the money to take the risk.
So I am going to die poor.
And saying what I like.

Presumably the gas fracking around Prague, Oklahoma has been going on around the clock since early 2010. So why are there earthquake spike as follows:


2011-11-06 Prague 5.6 35.5 -96.8


1882-10-22 El Reno 5.5 35.4 -97.8


1926-06-20 Bennington 4.9 34 -96.0


1929-12-28 Prague 4.8 35.5 -96.8


1939-06-01 Prague 4.8 35.5 -96.8


1952-04-09 Marshall 4.5 36.1 -97.6


1956-10-30 Arcadia Lake 4.5 35.6 -97.4


1959-06-15 Beaver 4.5 36.5 -100.7


1959-06-17 Wellston 4.4 35.7 -97.1


1961-04-27 Pittsburg 4.4 34.6 -95.9


1974-02-15 Noble 4.4 35.2 -97.3


1990-11-15 Spalding 4.4 35.0 -96.4


1995-01-18 Langston 4.3 35.9 -97.3


1997-09-06 Luther 4.3 35.6 -97.3


2010-02-27 Marble City 4.3 35.6 -94.9
2010-11-24 Marshall 4.2 36.1 -97.7
2010-10-13 Langston 4.2 35.9 -97.3


2011-11-05 Wellston 4.2 35.6 -97.1
2011-11-06 Coalpont lake 4.2 34.6 -96.5
2011-11-08 NE Faxon 4.2 34.5 -98.5


2012-04-03 Langston 4.1 35.8 -97.3


2013-04-16 Guthrie 4.1 35.7 -97.5
2013-04-16 Marshall 4.1 36.1 -97.6
2013-12-07 Langston 4.1 35.8 -97.3
2013-12-29 Prauge 4.1 35.5 -96.8


2014-02-09 Marshall 4.0 36.1 -97.6


2014-03-30 Lindsay 4.0 34.7 -97.6
2014-03-30 Ada 4.0 34.8 -96.7
2014-03-30 El Reno 4.0 35.5 -98


2014-04-05 Antioch 4.1 34.2 -97.5
2014-04-06 Wilburton 4.1 34.9 -95.3
2014-04-07 Catoosa 4.1 36.2 -95.8
2014-04-10 Prauge 4 35.5 -96.8 

Copyright © 2010 Leonard Geophysical Observatory

The majority of these events took place over a few recent years and one third of them over a century prior. They are not very large quakes. The largest of them the equivalent of a near gale. Not a strong gale, an F6 or so on the Beaufort scale. In fact there may well have been something like an F5 blowing in the area at the times of these things. So why are the last 2/3rds not more evenly spaced?

There was a force or lack of force acting with these dates. Most quakes occur in places that have no winds blowing. On meteorological charts these are cols or even actual storm fronts. Storm fronts are similar to tornado and hurricane Eyes. Periods of calm with pressures that are equally balanced. It would pay to learn what was going on in the region for those dates.

I don't have access to that data.

Gas Fracking and Earthquakes in Oklahoma


If anyone affected by the methane gas fracking process is reading this I hope you can ignore the bad language that erupts from time to time in my previous posts as I accommodate trolls and try to deal with a major stupid.
And fail.

The internet is wider open the Dodge and full of the worst kind of detritus that can survive a civil war and there are no cattle to rustle these days. Plenty of Klansmen though. And all sorts of vigilantes.

But, taken at their worst, the arguments -or for want of a better description, the lack of scientific arguments on Usenet is not worse than you are experiencing at the hands of regulated agencies, scientific institutions, journalism and the US justice system/Big Oil.

Here for example is the litany of evidence as presented scientifically by agencies who only seek to obscure their ignorance. (Who, for example would present the information in this manner?)

Date         City         Mag         Latitude         Longitude

2011-Nov-06          Prague         5.6         35.53162         -96.77137
1952-Apr-09         El Reno         5.5         35.4         -97.8
1882-Oct-22         Bennington         4.9         34         -96
2011-Nov-08         Prague         4.8         35.5179         -96.7858
2011-Nov-05         Prague         4.8         35.53849         -96.78069
2014-Mar-30         Marshall         4.5         36.13092         -97.62912
2013-Dec-07         Arcadia Lake         4.5         35.607         -97.38468
1974-Feb-15          Beaver         4.5         36.5         -100.693
2013-Apr-16          Wellston         4.4         35.68623         -97.08884
2012-Apr-03         Pittsburg         4.4         34.63852         -95.88232
2010-Oct-13         Noble         4.4         35.17552         -97.32081
1939-Jun-01         Spalding         4.4         35         -96.4
2014-Apr-07         Langston         4.3         35.89131         -97.27518
2010-Nov-24         Luther         4.3         35.612         -97.252
1926-Jun-20         Marble City         4.3         35.6         -94.9
2014-Mar-30         Marshall         4.2         36.12546         -97.63979
2014-Apr-06         Langston         4.2         35.89019         -97.26905
2013-Apr-16          Wellston         4.2         35.68074         -97.09777
1997-Sep-06         Coalpont lake         4.2         34.676         -96.499
1959-Jun-17          NE Faxon         4.2         34.5         -98.5
2014-Feb-09         Langston         4.1         35.89254         -97.29209
2014-Apr-10         Guthrie         4.1         35.77453         -97.48264
2014-Apr-05         Marshall         4.1         36.13124         -97.63078
2013-Dec-29         Langston         4.1         35.89136         -97.29668
2010-Feb-27         Prauge         4.1         35.535         -96.757
1995-Jan-18         Antioch         4.1         34.712         -97.542
1961-Apr-27         Wilburton         4.1         34.9         -95.3
1956-Oct-30         Catoosa         4.1         36.2         -95.8
2011-Nov-06         Prauge         4.0         35.519         -96.784
2014-Mar-30         Marshall         4.0         36.13519         -97.62569
1990-Nov-15         Lindsay         4.0         34.761         -97.55
1959-Jun-15         Ada         4.0         34.8         -96.7
1929-Dec-28         El Reno         4.0         35.5         -98

Copyright © 2010 Leonard Geophysical Observatory 


http://www.okgeosurvey1.gov/pages/earthquakes/information.php

It is the nearest you can get to criminal obfuscation without proving intent.

What the general public wants to know (and what the specialist agencies KNOW they want to know (and ALL the vested interests listed above DON'T want you to know)) is:
 
2011-Nov-06          Prague         5.6         35.53162         -96.77137
2011-Nov-08         Prague         4.8         35.5179         -96.7858
2011-Nov-05         Prague         4.8         35.53849         -96.78069
2014-Mar-30         Marshall         4.5         36.13092         -97.62912
2013-Dec-07         Arcadia Lake         4.5         35.607         -97.38468
2013-Apr-16          Wellston         4.4         35.68623         -97.08884
2012-Apr-03         Pittsburg         4.4         34.63852         -95.88232
2010-Oct-13         Noble         4.4         35.17552         -97.32081
2014-Apr-07         Langston         4.3         35.89131         -97.27518
2010-Nov-24         Luther         4.3         35.612         -97.252
2014-Mar-30         Marshall         4.2         36.12546         -97.63979
2014-Apr-06         Langston         4.2         35.89019         -97.26905
2013-Apr-16          Wellston         4.2         35.68074         -97.09777
2014-Feb-09         Langston         4.1         35.89254         -97.29209
2014-Apr-10         Guthrie         4.1         35.77453         -97.48264
2014-Apr-05         Marshall         4.1         36.13124         -97.63078
2013-Dec-29         Langston         4.1         35.89136         -97.29668
2010-Feb-27         Prauge         4.1         35.535         -96.757
2011-Nov-06         Prauge         4.0         35.519         -96.784
2014-Mar-30         Marshall         4.0         36.13519         -97.62569

Of the 33 earthquakes large enough to register world-wide since records began in 1882 the year that lead up to the freezing weather that pulled the plug on cattle drives: twenty of them (20/33) 0.60606060606.
 
Or to keep it simple for the folks it is intended to bamboozle:
Two thirds of them occurred in a region prone to tremors at the rate of one every ten years...
in 3 1/2 years.

1952-Apr-09         El Reno         5.5         35.4         -97.8
1882-Oct-22         Bennington         4.9         34         -96
1974-Feb-15          Beaver         4.5         36.5         -100.693
1939-Jun-01         Spalding         4.4         35         -96.4
1926-Jun-20         Marble City         4.3         35.6         -94.9
1997-Sep-06         Coalpont lake         4.2         34.676         -96.499
1959-Jun-17          NE Faxon         4.2         34.5         -98.5
1995-Jan-18         Antioch         4.1         34.712         -97.542
1961-Apr-27         Wilburton         4.1         34.9         -95.3
1956-Oct-30         Catoosa         4.1         36.2         -95.8
1990-Nov-15         Lindsay         4.0         34.761         -97.55
1959-Jun-15         Ada         4.0         34.8         -96.7
1929-Dec-28         El Reno         4.0         35.5         -98

Get it?
One every 10 years then 20 every 4.16 years.

Or, for those who like to manipulate statistics: 20 every 50 months.
My maths is pretty poor, someone can correct it I am sure but 1 every 75 days is a lot more than one every forty thousand to forty five thousand days.

Open up a spreadsheet and arrange them in order of magnitude by all means but keep the data in context. Rather than arranging them by largest quake forst, I'd arrange them by date:

2011-Nov-06      Prague     5.6     35.53162     -96.77137

1882-Oct-22     El Reno     5.5     35.4     -97.8

1926-Jun-20     Bennington     4.9     34     -96

1929-Dec-28     Prague     4.8     35.5179     -96.7858

1939-Jun-01     Prague     4.8     35.53849     -96.78069

1952-Apr-09     Marshall     4.5     36.13092     -97.62912

1956-Oct-30     Arcadia Lake     4.5     35.607     -97.38468

1959-Jun-15     Beaver     4.5     36.5     -100.693

1959-Jun-17      Wellston     4.4     35.68623     -97.08884

1961-Apr-27     Pittsburg     4.4     34.63852     -95.88232

1974-Feb-15      Noble     4.4     35.17552     -97.32081

1990-Nov-15     Spalding     4.4     35     -96.4

1995-Jan-18     Langston     4.3     35.89131     -97.27518

1997-Sep-06     Luther     4.3     35.612     -97.252

2010-Feb-27     Marble City     4.3     35.6     -94.9
2010-Nov-24     Marshall     4.2     36.12546     -97.63979
2010-Oct-13     Langston     4.2     35.89019     -97.26905

2011-Nov-05     Wellston     4.2     35.68074     -97.09777
2011-Nov-06     Coalpont lake     4.2     34.676     -96.499
2011-Nov-08     NE Faxon     4.2     34.5     -98.5

2012-Apr-03     Langston     4.1     35.89254     -97.29209

2013-Apr-16      Guthrie     4.1     35.77453     -97.48264
2013-Apr-16      Marshall     4.1     36.13124     -97.63078
2013-Dec-07     Langston     4.1     35.89136     -97.29668
2013-Dec-29     Prauge     4.1     35.535     -96.757

2014-Feb-09     Marshall     4.0     36.13519     -97.62569

2014-Mar-30     Lindsay     4.0     34.761     -97.55
2014-Mar-30     Ada     4.0     34.8     -96.7
2014-Mar-30     El Reno     4.0     35.5     -98

2014-Apr-05     Antioch     4.1     34.712     -97.542
2014-Apr-06     Wilburton     4.1     34.9     -95.3
2014-Apr-07     Catoosa     4.1     36.2     -95.8
2014-Apr-10     Prauge     4.0     35.519     -96.784

There is forcing here. I won't be considered an expert witness. I might even be used in a smear campaign in order to get the statistics laughed out of court. But I can see that the loading is not sequential but composite.

Once the aquifers were charged adding more filthy water to it wouldn't cause the episodes. They were caused by the same triggering mechanisms that cause earthquakes any cycle of any century.

If they could gain access to the documentation of water use, you will find that the wells needed recharging after the quakes. It is only when charged can the earth react to the first cause.

It is not known (but it is not necessary to know) what the first cause is. My own personal beliefs may be misleading. I am sure that they can be used by interested parties to be damaging to the case as far as the innocent are concerned. I personally believe that the innocent will be the civilians who have been hurt and the criminals will be the ones who have profited.

But I am just going by the adage of "Follow the Money". In which case you could say this has all been engineered by a conspiracy of lawyers. They fight on both sides.

It is difficult to deal with stuff like this impartially. On the side of the defence for the Gas Companies, there well may be a method for alleviating this stress without causing damage -or a way of continuing the fracking business, presenting the innocent home owners with options and warnings for periods when seismic activity is highly likely.

How might this be done?

Friday, March 27, 2015

America the grift that gives on grifting

Some sick bastard I would like to kill all over again has just driven an airplane into a mountain while the 140 passengers and the other aircrew died kicking and screaming.

What annoys me is that he screwed me over too. And I am am also upset that I am as upset about that as I am about all those innocent people he murdered.

There was some reason to believe that the electronic problems I had heard reports about could be an indication of a large magnitude earthquake. With that on hold in the back of my mind I cam across news of a downed airliner. So I put two and two together and made minus four.

And it shit mightily on me. I feel depressed that I fell for that turd and I  feel depressed that I feel depressed for the wrong reason.

And the worst thing is that it is all down to the fact the the USA political system could result in the most powerful person in the world being a chimpanzee. Who else but a chimpanzee would pass ill considered laws supposedly against terrorism that would result in pilots not being able to take a piss?

It hurt me that they could have a nit-wit in charge of a state the size of Texas get elected president after presiding over the Tulia scandal ...but the arsehole just keeps on keeping on. ANY civilised country would at least have hauled him into a court of human rights.
But that doesn't apply to a chimpanzee nor to  a country that would elect one.


27/03/2015 17:45
Pacific Daylight Time


Pacific Daylight Time?
Really?
WTF?

How do I adjust the clock on this thing?

Saturday, March 21, 2015

The Mistakes Monkeys Make 2

In the second part of chapter one: https://youtu.be/t29XAqff1ak the narrator of the programme, Aubrey Manning, lets the local geologist at Barbican Mountainland speak of the geological formations he found there. That the whole region is made up of slabs one atop the other.

I couldn't understand his description of "serpents" "putrified" but it obviously fit in with what the narrator wanted him to say: "Originally they would have been horizontal, they represent an history of rivers, a loooong history of deposition."

So there is the proof; the word loooong. Any fossils are missing apparently. If that is what apparent means. The narrator states that to 19th century scientists a world made up of layers didn't look as if it had been created all in one go as the bible says. (3:30)

Excuse me but it doesn't say it was all created in one go and the presentation does not look like layers of sedimentation. Have a look at the waves presented in 3:46. (You can call them fold if you like.) It must have been built up over time. I can't quarrel with that. Just remove the words built up and time. (Unless you have proof of course. A wide margin is the usual requirement if it is all subjective. A wwiiidde margin.)

What it actually looks like is an hydraulic process that doesn't look much like anything we are familiar with. "How much time?" (4:00) Piquant that the producers edited the video to include surf at this point. So much for time. In fact
what is time to anyone who believes in a miracle like the Big Bang?

I would never accept the term scientist but I am slightly sentient (to some things.) How long does it take for something to happen instantly, as in a rather large bang, not necessarily The Big Bang but something of a whopper?

How long for example would the process of mountain raising take?
Suppose a process in which the earth stood still long enough to make the moon shudder. What would happen to a large mass of semi-liquid quartz solution in water. Can you have a semi-liquid solution?

Is it possible it might wave goodbye to the "springs of the deeps"? Mr Manning doesn't mention this part of the bible: "on that day all the springs of the great deep burst forth". Maybe he was unfamiliar with it. Are you?

Genesis chapter 7 gives an account of a flood, a rather silly thing to put in a potted history of the world if it wasn't true, especially if the people you wanted to convince were somewhat contrary. The whole history of Moses, once he left the safety of Pharaoh's palaces, was one of contention after contention with the very people he had freed from slavery.

Maybe he thought he had a right to expect them to believe anything that he said. Look how people like Che Guevara have been able to convince their followers. Maybe the key was to keep it simple. A succinct jingle is far more persuasive than a tome of scientific mumbo jumbo. Look how many people know the phrase: “I would rather die standing up than live life on my knees” for example.
It works, except it isn't a choice most make.

Perhaps people will do and believe anything they want to, in any period of history?
So I don't think I am going to bother trying to get anyone to believe they were not born in soup, if that is what they want to think. Attempting to pour reason down someone's throat is a recipe for disaster.

Friday, March 20, 2015

The Mistakes Monkeys Make

When I first got holds of a copy of Aubrey Manning's work "Earth Story" I was very much taken with it. I was delighted with some of the things the video was showing me, without necessarily forcing me to believe what the monkey was telling me.

Now I think it is time to set the matters straight. At least, I am going to have a damn good try. Using the neatly clipped editions available on You Tube I am going to point out places where discussion of alternative conclusions might have been inserted to make the series priceless.

Here is the first part of Episode 1: https://youtu.be/YpbevfWrYg0

Five and an half minutes into the programme, the narrator speaks about discoveries in Southern Africa. Could the Barberton mountains be a region from before the life on earth began?

There is no reason to suppose it might not be but a body would be a fool to pass over any alternative consideration. Not that it makes any difference to any that did or didn't live way back them. They will all be dead by now. But it IS something that brings creature comfort to monkeys.

But any man who considers himself to be a monkey automatically denies he is a creature, since he no longer believes in creation. So creature comforts are thus denied him. Hence I have no problems discomfiting such.

The most obvious reason for the lack of fossils in any region is the likelihood for their not forming, not that they never could have.
So what alternatives are there?

1. The mountains were already mountains at the time of fossil formation.
2. All subsequent layering never happened, despite the presence of life in the region.
3. The fossils were all washed away somehow.

These were just ideas I came up with in the last few minutes, at the time of wring this post. What the narrator goes on to suggest is actually stupid:

6:15: Two hundred years ago, people in the western world would have believed quite literally in the story of creation. Genesis tells us that god created the earth and all the living creatures in JUST six days...
But it doesn't. And who really knows what anyone believed 200 years ago?
Since there were people willing to commit hideous crimes (just as there are today) some obviously subscribed to the idea of Survival of the Fittest.

6:30 He says that the biblical account implies earth and human history began at the same moment.

The truth is that in the western world, since the dark ages, all so called Christian beliefs were controlled by the Pope. Any that protested the hierarchy were dealt with violently. The facts are that the Catholic idea of creation was very wide of the bare statements about creation mentioned in the bible. And as for the chronology of that church's fathers, they officially believed in a geo-centric solar system and universe until very recently.

A man may be excused for his ignorance but to fail to check his facts and making such monstrous errors is a great pity. But not unusual. I don't wish to put anyone off looking for himself but here is the description Moses came up with:

"In the beginning God created the heavens and the earth. Now the earth was formless and empty, darkness was over the surface of the deep, and the Spirit of God was hovering over the waters. And God said, “Let there be light,” and there was light.
God saw that the light was good, and he separated the light from the darkness.
God called the light “day,” and the darkness he called “night.” And there was evening, and there was morning—the first day."

It doesn't mention anything about life outside the spiritual universe. It does mention a day. But it doesn't say where.
It mentions waters but we don't know what is meant by the term "waters". If there was no light until the spirit started warming the chaos up, there is unlikely to have been any heat either since they are one and the same thing.

If there was no heat, there was no water. Not literal water, at least. But be honest, considering he was a single man working off his own bat with little of no guidance from the other monkeys, you have to admit that what Moses wrote has stood the test of time remarkably well.

Now do yourself a favour and look up the meaning of Right Ascension. Mr Manning never. But then he never read my blog, did he?

These days everyone has access to any amount of translations of the Genesis account. Here is Young's version but I have brought the language up to date:
In the beginning of God’s preparing the heavens and the earth the earth existed waste and void and darkness on the face of the deep and the Spirit of God fluttering on the face of the waters and God said, ‘Let light be;’ and light is.
And God saw the light, that [it is] good, and God separated the light and the darkness and God called the light ‘Day,’ and the darkness He called ‘Night;’ and there is an evening, and there is a morning, day one.

I may have taken liberties but than Young did the same. For one example, the original languages used completely different forms of punctuation. Obvious difficulties existed in translation especially in his day. But since then more versions and copies of earlier versions have been found.
***

And that is the end of part One of Episode 1.

I am rather tempted to continue...

Wednesday, March 18, 2015

The Mightbe Mississippi

I have just been reading of the demise of the ports on the Mississippi and the US military's efforts to preserve them. Apparently it is losing at the rate of 1 football field every 48 minutes. While 48 minutes is further from 3/4 of an hour than a football field is from 3/4 of an acre; given the numbers and varieties of sizes and shapes of football field and the discrepancies allowed for in the data collection, we might be allowed enough leeway to wonder why they used such a woolly minded term rather than a more suitable acre/hour.

Is it because the US  public has moved so far from the farm that they can no longer imagine how large an acreage an acre is?


Because I am having trouble imagining which acres are going where in any particular three quarters of an hour or whatever. Although there are some buildings in the pictures (big ones) that might be used for comparison.

One or two in the second picture might well supply images of acre sized warehousing for comparison.

http://earthobservatory.nasa.gov/IOTD/view.php?id=85519

I can't see why they just don't dig a channel through to Lake Pontchartrain and have a new port entirely. It would be the size of Portsmouth or Poole. Is it that military intelligence requires militants to think?

Whatever the case the salient facts have nothing to do with the salient:

"Left alone, nature would probably send the Lower Mississippi River whipping back and forth across a 200-mile arc every few thousand years."

"By the 1950s, it was clear to the Army Corps that the great river was beginning to shift, as the amount of water escaping from the Mississippi and flowing into the Atchafalaya River had increased from 10 percent in 1850 to 30 percent in 1950."

"Prior to major river engineering, the combined Mississippi-Atchafalaya River system transported an average of 400 million metric tons of sediment to coastal Louisiana each year. Today the average is more like 170 million tons, a 60 percent drop."

That last fact is the key. There is 400 metric tons/year spread over 200 miles/2000 years. That's just 160,000,000, tons of clay since Noah. Nobody knows what else is down there.

You can do what you like to the surface but given an unknown depth of silt lies over anyone's guess at the porosity of bedrock. Where the river goes is always going to be up to the river. And, so far, it would appear that I am the only fool daft enough to consider it worth mentioning.

"Ten thousand River Commissions, with the mines of the world at their back, can not tame that lawless stream, can not curb it or confine it, can not say to it, Go here or Go there, and make it obey. —Mark Twain, Life on the Mississippi".

It's been a while since I read that book (and if you are intending to learn any of the earth sciences, you should start with that one.) However, you should bear in mind that the guardians of the forests (man and beasts) ensured the carpet of trees was virginal until 400 years ago and still in good shape between the Mississippi and the Rockies for over half of the last 200.

Friday, February 27, 2015

Pineapple Express

It looks like the second Pineapple Express is headed for North America this year


Looks like another one is heading towards BC from Hawaii early in March. It is a ridiculously far-out forecast to attempt but this is how it may go:
A deep Low out of China has left Japan and is currently deepening at 1000mb. There is some compression on its eastern front despite the size of the adjacent anticyclone.


There is a large, fairly flaccid High (1028) that has been sitting 160 west to 160 east for some time. There is a similar system on the east coast separated by a col that is about 10 degrees wide (1016 at the saddle-point.)

The Low compresses the High which dissipates south as a second cyclone (1008) builds at 160 west by 1 March 2015. This system compresses at the expense of the easterly High (1032) at that time.


As the eastern High dissipates a thirds cyclone develops from the col, which is now lying NW from Hawaii at 150 degrees west. The two original cyclones break into three or four centres as the original breaks up over the Aleutians. This complex lies in a straight line running NW to SE.


Now that you are waiting for this system to trough out on the 4th or whenever the Norks have secretly infiltrated a new Anticyclone you should have been watching, fools!


This thing has swept in unnoticed under that Japanese storm and now taken centre stage in the North Pacific. But not to worry, here comes retired Colonel Captain America. Daft name I know but what can you do? Wearing his underpants outside his trouser for they are particular in the way they dress over there. (It is dealing with those inscrutable vassals that keep knocking them all to hell that does it.)


Springing up out of that Col the NSA had secretly inserted in Hawaii the new cyclone lies along the line NW from there and will protect the USA and its as yet unconquered allies. On the 5 March the prick infiltrates the Pacific in the direction of the Gulf of Alaska. Until finally... dan dan dan dan DAAAAHHHn!
It puts on the S.H.I.E.L.D: "Take that [kapow] and that [kapow2] and that [kapow3 you commie fuckers]" Wait, wrong film... Isn't this the one where he is fighting with his boyfriend on the roof of a train?


http://mkwc.ifa.hawaii.edu/models/modelsanim.cgi?model=gfs&domain=npac&param=winds&orient=horiz&level=sfc&modeltime=2015022700&gfsanimduration=384&banner=mkwc&imgsize=Large&animtype=flash

Wednesday, February 25, 2015

Forecasting volcanic activity 2 (or not, as the case may be)

I was going to complete the effort to diagnose the method of forecasting earthquakes but something interesting cropped up: Extra tropical overland storms; to wit, Dust storms.

http://youtu.be/adKwG9ZuzFw
https://www.youtube.com/watch?v=adKwG9ZuzFw

I was expecting something more northern that those we had, never the less, we did have something. But what occupied my attention was the fact that the following pair of earthquakes did not mature until late:

2015/02/24


Latitude Longitude Magnitude
13:11:00 12.42 51.06 4.5 Mb Gulf of Aden
10:23:00 12.97 51.07 4.9 Mb Gulf of Aden

Now here is the thing: It always forms when there are strong gales and low category hurricanes/typhoons. At the moment there are none showing. So something is wrong in the system. In the meantime we can make use of the chart to show something that ALWAYS occurs when storms end:
Twin (or treble) parallel fronts.
On the chart above they are the two blue lines of triangles that run from the centre down along the coast of Europe to the bottom left of the picture. They don't have to follow that course. And they don't have to be blue. But for now you can see where the seismic disturbances foretold some 7 1/2 hours in advance will have arrived by now (12:36 at the time of writing.)

Just find pairs or triple earthquakes on this page.

But of course, they never arrived. There is a reason for that. And I don't know what it is. But of course nothing in geo-physics is gospel (except that which is actual gospel.)

With what are called higher latitudes (than either tropics, places further from the equator that those that have tropical storms) storms move in the opposite direction to tropical storms.

I don't know much about upper atmospherics but the strongest storms are created with a cyclone at the base and an anticyclone aloft. I have been assured this is so as far as the tropics is concerned. I have no idea what the conditions are for higher latitude altitudes.

Feels like that music. Pity it won't play.

Monday, February 23, 2015

Forecasting volcanic activity 1

From a letter initially posted to the owner of: http://www.volcanolive.com/contact.html


When three cyclones on a weather chart line up you may expect seismic disturbances that are likely to be of that nature. I have yet to find a way of locating centres but for now:

On all regional charts that cover at least half an ocean/continent the length of time these weather systems hold position is crucial. Too short a time frame indicates seismic tremors, longer periods -enough to feature in 2 charts 12 hours apart, indicate a stronger likelihood for volcanism to be the outcome.

I believe the longer the feature is present on weather forecasts, the more powerful the event will be.

There are a number of other features that go hand in hand with the above but this information is all you need to look at to assure yourself that this effect is true.
(More often than not.)

***

A synoptic scale chart:


At the time of writing this is the latest public forecast chart from the British Meteorological Office. They are generally issued about 7 1/3 hours after the analysis chart (above) has been prepared and accepted.

From all the available date the following forecasts are prepared, run and checked and, when the chief meteorologist is satisfied, published.

The North Atlantic has been the most comprehensively studied region in the universe for over a century. It's importance to commerce and the number of countries that border the Atlantic will ensure it remains so for a long time to come.

You should, by now, be very familiar with it. It is as important a piece of your education as anything you learned in maths, Physics and the language of your nation. If you are unfamiliar with it and live alongside or near to the North Atlantic you may wish to consider suing your educators. I will furnish as much assistance to that end as I can.

You are unlikely to get very far though. The reason being that the scientists involved although very capable are incompetent. I think that can easily be proven:
How many years have scientists had seismographs at their disposal?

How many years have they had access to the Internet?

How far along in earthquake and volcano forecasting have they got in all that time?

And the biggie:
How far ahead are weather forecasts of any value?

Point made.
Point taken?


***

A synoptic chart is made up of mesoscale derived data. Stuff from mesoscale sized systems, hurricanes for instance or more usually northern cyclones and anticyclones will be quite closely studied. And the weather stations available for the North Atlantic charts are extremely good.
So good, in fact, that we are able to discern earthquake signals from it:

On the above chart you can see black lines forming concentric rings that almost fill the North Atlantic basin. This is a blocked low. From the other forecasts in today's run, we can see it is not going anywhere for a while. It is what we call an Icelandic low, a semi-permanent feature of the weather at seal level in the North Atlantic.

Now here is the thing:
It always forms when there are strong gales and low category hurricanes/typhoons. At the moment there are none showing. So something is wrong in the system.
In the meantime we can make use of the chart to show something that ALWAYS occurs when storms end: twin or treble parallel fronts. On the chart above they are the two blue lines of triangles that run from the centre down along the coast of Europe to the bottom left of the picture.

They don't have to follow that course. And they don't have to be blue. Most charts were origianlly written in black and white, so the pictographs say as much as Egyptian Hieroglyphs. The blue triangles indicate a line of cold weather running east to west.

The red lines that look like lines of cartoon mice are warm fronts. Regions where the system is warm running east to west. East to west is the normal direction for storms in the northern hemisphere. But they can move the other way. It may be possible to use such directions to forecast other geo-physical phenomena. Volcanic eruptions perhaps.

But for now you can see where the seismic disturbances foretold some 7 1/2 hours in advance will have arrived by now (12:36 at the time of writing.)

Just find pairs or triple earthquakes on this page:

10:36 -24.24 -66.73 5.1 ML SALTA, ARGENTINA
10:25 -36.58 177.19 5.2 Mb OFF E. COAST OF N. ISLAND
09:05 -5.63 152.70 4.9 Mb NEW BRITAIN REGION, P.N.G
08:04 40.80 46.20 4.3 Mb Eastern Caucasus
08:00 35.57 140.20 4.6 Mb NEAR EAST COAST OF HONSHU<<
06:36 25.50 95.70 4.5 Mb Myanmar-India border re
01:37 39.84 143.43 4.7 Mb OFF EAST COAST OF HONSHU<<
00:48 -4.44 126.40 4.7 Mb BANDA SEA
00:09 -3.45 139.02 4.8 Mb PAPUA, INDONESIA
2015/02/22

22:39 -0.04 123.88 4.3 Mb SULAWESI, INDONESIA

Close; but no cigar.
There should be a series of consecutive earthquakes on the list that are on the same epicentre to within a degree or so either way. The columns run:
Date, time, latitude, longitude, magnitude and region.

There should be three sets too:
The warm fronts in western Europe, the cold fronts mentioned above and the warm fronts that join the very ends of those.
I have complete confidence they will arrive. There are no tropical storms but I am quite confident too that such storms as are required to fit the picture are already running. But they are not tropical. They have as much energy as a Hurricane though -or did.

Look them up in today's weather reports/news bulletins:
"Stormy weather 23 February 2015"

They will appear on here or the NEIC list (Archives.)

The consecutive earthquakes will arrive on time, just not on my time. (or the meteorological time.)
So, look forwards to more on this, later.


The Hawaiian North Pacific charts

Administered  by the Institute for Astronomy, in cooperation with the Department of Meteorology, at the University of Hawaii at Manoa

Mauna Kea Weather Center Disclaimer:
The MKWC is a weather research and forecast facility funded by the astronomical observatories on Mauna Kea; it is not a government-provided service like the National Weather Service (NWS).

The general public is welcome to use the MKWC, but should be aware that its primary mission is to support the observatories and that the funding level does not permit the same level of service or reliability that one expects from a publicly-funded facility, such as the National Weather Service.

We welcome constructive comments from all MKWC users, and strive to provide the best possible service consistent with our mission and resources. Occasionally, products will not be available because of hardware/software difficulties. In such cases we are aware of the trouble and your patience is appreciated.

***

To:

From:
Michael McNeil
Email:
Weatherlawyer@gmail.com
Subject: Model data

Comments:

Your North Pacific sea level forecasts are in my top 3 "go to" sites in the world. Can you please tell me how much work goes into their preparation?

You state that the funding only allows you minimal interference with the raw data, can you give me some idea how the charts are prepared (and hopefully tell me how they will never be "improved".)

I am fairly serious about that last bit, I am sure perfecting you model with improvements and refinements will spoil it for me. I was looking through your archive hoping to find something along the lines of the reanalysis project stored on your servers. Not that I wan't them reworked so much as re-presented.

If you have stored previous forecasts they will prove a valuable commodity one day. I won't tell you what I am doing with them for fear you will consider me a crank. Thanks for allowing us access to your stuff.

Mike.

Sunday, February 22, 2015

To all my many fans

We have enabled automatic spam detection for comments. You should occasionally check the comments in your spam inbox. Learn more about Blogger's spam detection or report issues.

I have no idea where the inbox is never mind the spam. I have gmail account if you want to comment but I will definitely find you if you respond to a post on sci.geo.earthquakes.

The other thing is the colour of the blog. Who the hell thought that white on black was a good idea?

Morons!